The Optimization Center is designed to identify license savings opportunities. From this report, you can review unused, duplicated, or over-allocated licenses, and you can see users who are not taking advantage of the features enabled by their licenses. The ultimate goal is to optimize the licenses assigned to users and to free up more expensive licenses for those users who need them.
If License Pools are configured, a table showing the breakdown by license pools will be visible on this page. If not, clicking on a widget will take you to the relevant report where you can view data by user.
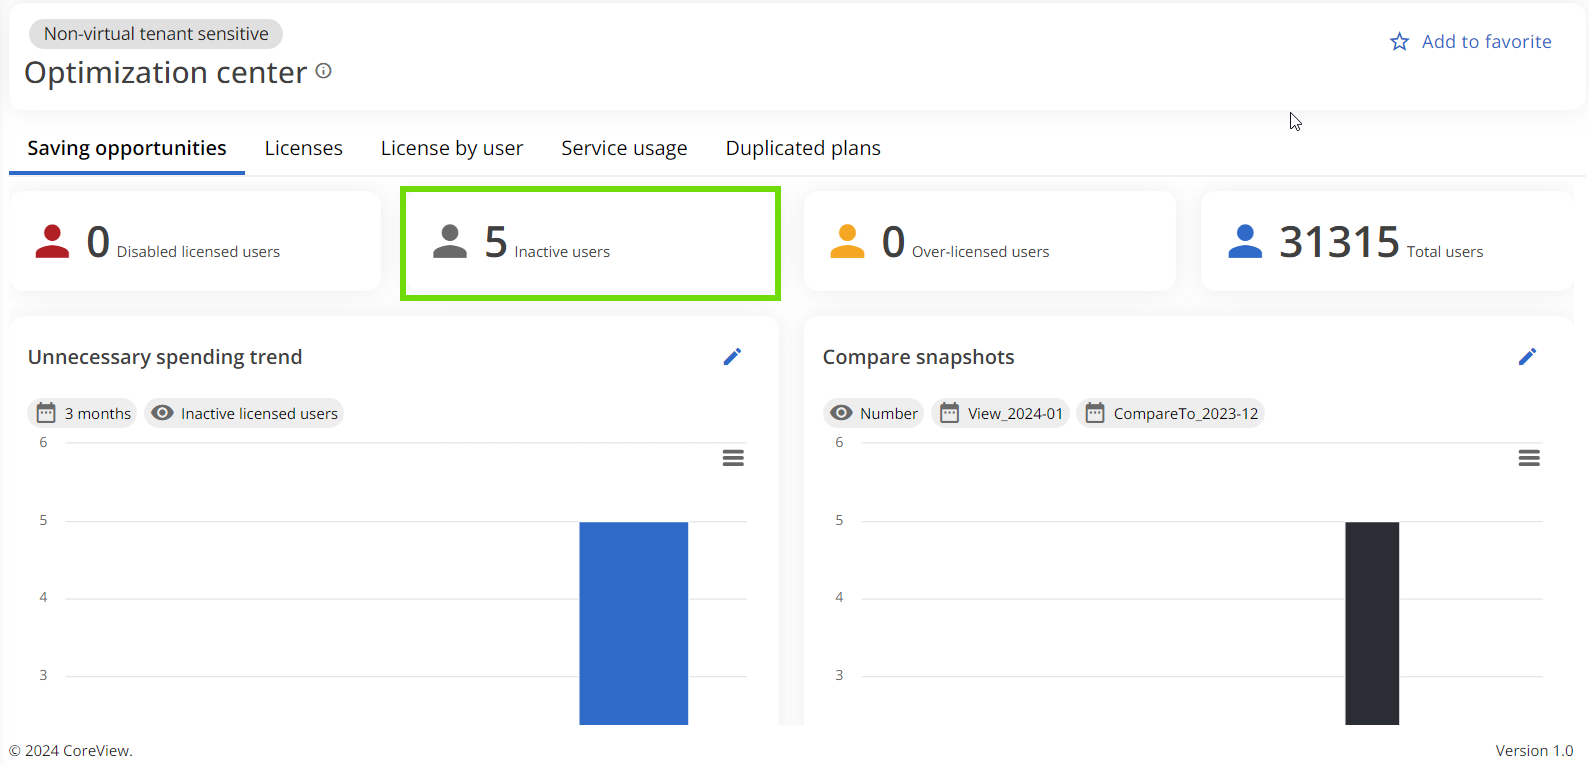
Saving opportunities
The “Saving opportunities” report is based on three different saving drivers: disabled licensed users, inactive licensed users, and over-licensed users. This report focuses on “primary licenses”, those Microsoft 365 and Office 365 licenses that provide the essential apps to the users. The list of licenses defined as “primary” are the ones part of:
- Enterprise Mobility + Security (EMS)
- Microsoft 365 Enterprise
- Microsoft 365 Frontline
- Office 365 Enterprise
- Microsoft 365 GOV
- Office 365 GOV
- Microsoft 365 Educational
- Office 365 Educational
- Microsoft 365 Business
- Microsoft 365 Apps
The definition of the savings drivers is as follows:
- Disable licensed users: users with a primary license and blocked credentials
- Inactive licensed users: enabled users with ALL primary licenses inactive for at least 90 days. This uses the “IsActive90” field.
- Over-licensed users: enabled users with more than one primary license, at least one of which is active.
Calculating IsActive90
The fields “IsActive90” and “IsActive30” are calculated by CoreView based on a number of different attributes. Below are the attributes that contribute to “IsActive90”.
| Application | Rule |
|---|---|
| Exchange | Exchange Plan not empty AND Last Exchange User Action within last 90 days AND RecipientType = UserMailBox. If "Skip Active MailUser" is false, then we also consider RecipientType=MaillUser |
| OneDrive | OneDrive Plan not empty AND Last OneDrive Action within last 90 days |
| SharePoint | SharePoint Plan not empty AND SharePoint Last Action within last 90 days |
| Viva Engage | Viva Engage Plan not empty AND Viva Engage Last Activity Date within last 90 days |
| Teams | Teams Plan not empty AND Teams Last Activity Date within last 90 days |
| PowerBI | PowerBiPro Plan not empty AND Power BI Last Action within last 90 days |
| Office 365 Installations | Office365Pro Plan not empty AND M365 Client App Last Activity Date within last 90 days |
| CRM | CRM last activity date within last 90 days AND SKU is in the following list: [“Dynamics CRM","Dynamics 365","DYN365","CRM","D365","Dynamics_365"] |
Licenses
It provides insights into which users are utilizing products/services associated with specific licenses. This report enables you to reassign or disable licenses as needed and engage with users who are not fully leveraging their licenses.
Primary Licenses Count
This property accounts for the main Microsoft 365 and Office 365 licenses that provide essential apps to users. It excludes separately purchased add-ons and services, such as Teams and Exchange Online.
Advanced Filters
The Advanced Filters feature allows you to refine your search based on combinations of license and application usage. These filters serve two main purposes:
- Acting as filter criteria
- Providing a running total of matching records
For example, in a tenant of 1,000 users where 50 have E5 licenses, filtering to display E5 users will recalculate the services/applications being used by those 50 users.
Filter levels
The filter operates on three levels:
- SKUs
- Service usage
- Usage map
Using filters in combination
Here's how to use these filters in combination:
- Select SKUs: Choose one or more primary SKUs (e.g., Microsoft E5 license).
-
Service usage:
- From the “Service usage” section, select a service (e.g., SharePoint) and mark it as “Inactive”. This filter will return users with an E5 license who have not used SharePoint in the last 90 days. These users can potentially be moved to an E3 plan to optimize license usage.
- Selecting a service as “Active” will return users who are actively using that service while on the selected license plans.
- Marking a service as “Ignore” will not consider any activity or inactivity on that service.
-
Usage map:
- The “Usage map” filter will automatically update to show icons of active services next to the count of users actively using them. This serves as a preview of the information available in the report under the “Active plans” property for each user.
- Checking a usage map in the filters will further refine the results, displaying only the selected users.
Important considerations
- Unclear values: If the filter is not used correctly, unclear values may be returned. For instance, if no SKU is selected for a user but a service is marked as active or inactive, the same user might appear in the query. This occurs because they might be actively using a service on one SKU but not on another SKU or integration assigned to them.
- Add-on licenses: If you do not select a primary license but choose an add-on, such as Teams Exploratory, and then mark the Teams service usage as inactive, this may return 0 results. In such cases, the SKU filter will be automatically removed, and the filter will search for users inactive on Teams independently from their assigned SKU.
- Column filters: The Advanced Filters count respects any column filters that have already been applied.
Visio and Project usage data visibility
The last usage information for Visio and Project will not be visible if the “Display concealed user, group, and site names in all reports” option is enabled in the Reports section of the Microsoft Admin Center. This setting prevents the association of usage data for Visio and Project with the corresponding users. For more information, please refer to the Microsoft documentation.
License by user
The “License by user” report flattens out the license data for users to make it easier to find users who have combinations of licenses. It gives an overview of how your Office 365 licenses are distributed and utilized across your users. It provides each user’s full name, login name, Subscription type, and licenses for Office web apps such as the Exchange license, Skype license, SharePoint license, and Office Professional Plus license.
Service usage
The “Service usage” tab helps you quickly and easily understand which licenses are being used across your organization, as well as the cost associated with them. You can track and analyze usage metrics departmentally, by domain, or by other criteria to get a full view of the costs and usage of your organization's licenses. From the “Advanced filters” panel you can exclude newly created users and hide the costs columns for better readability.
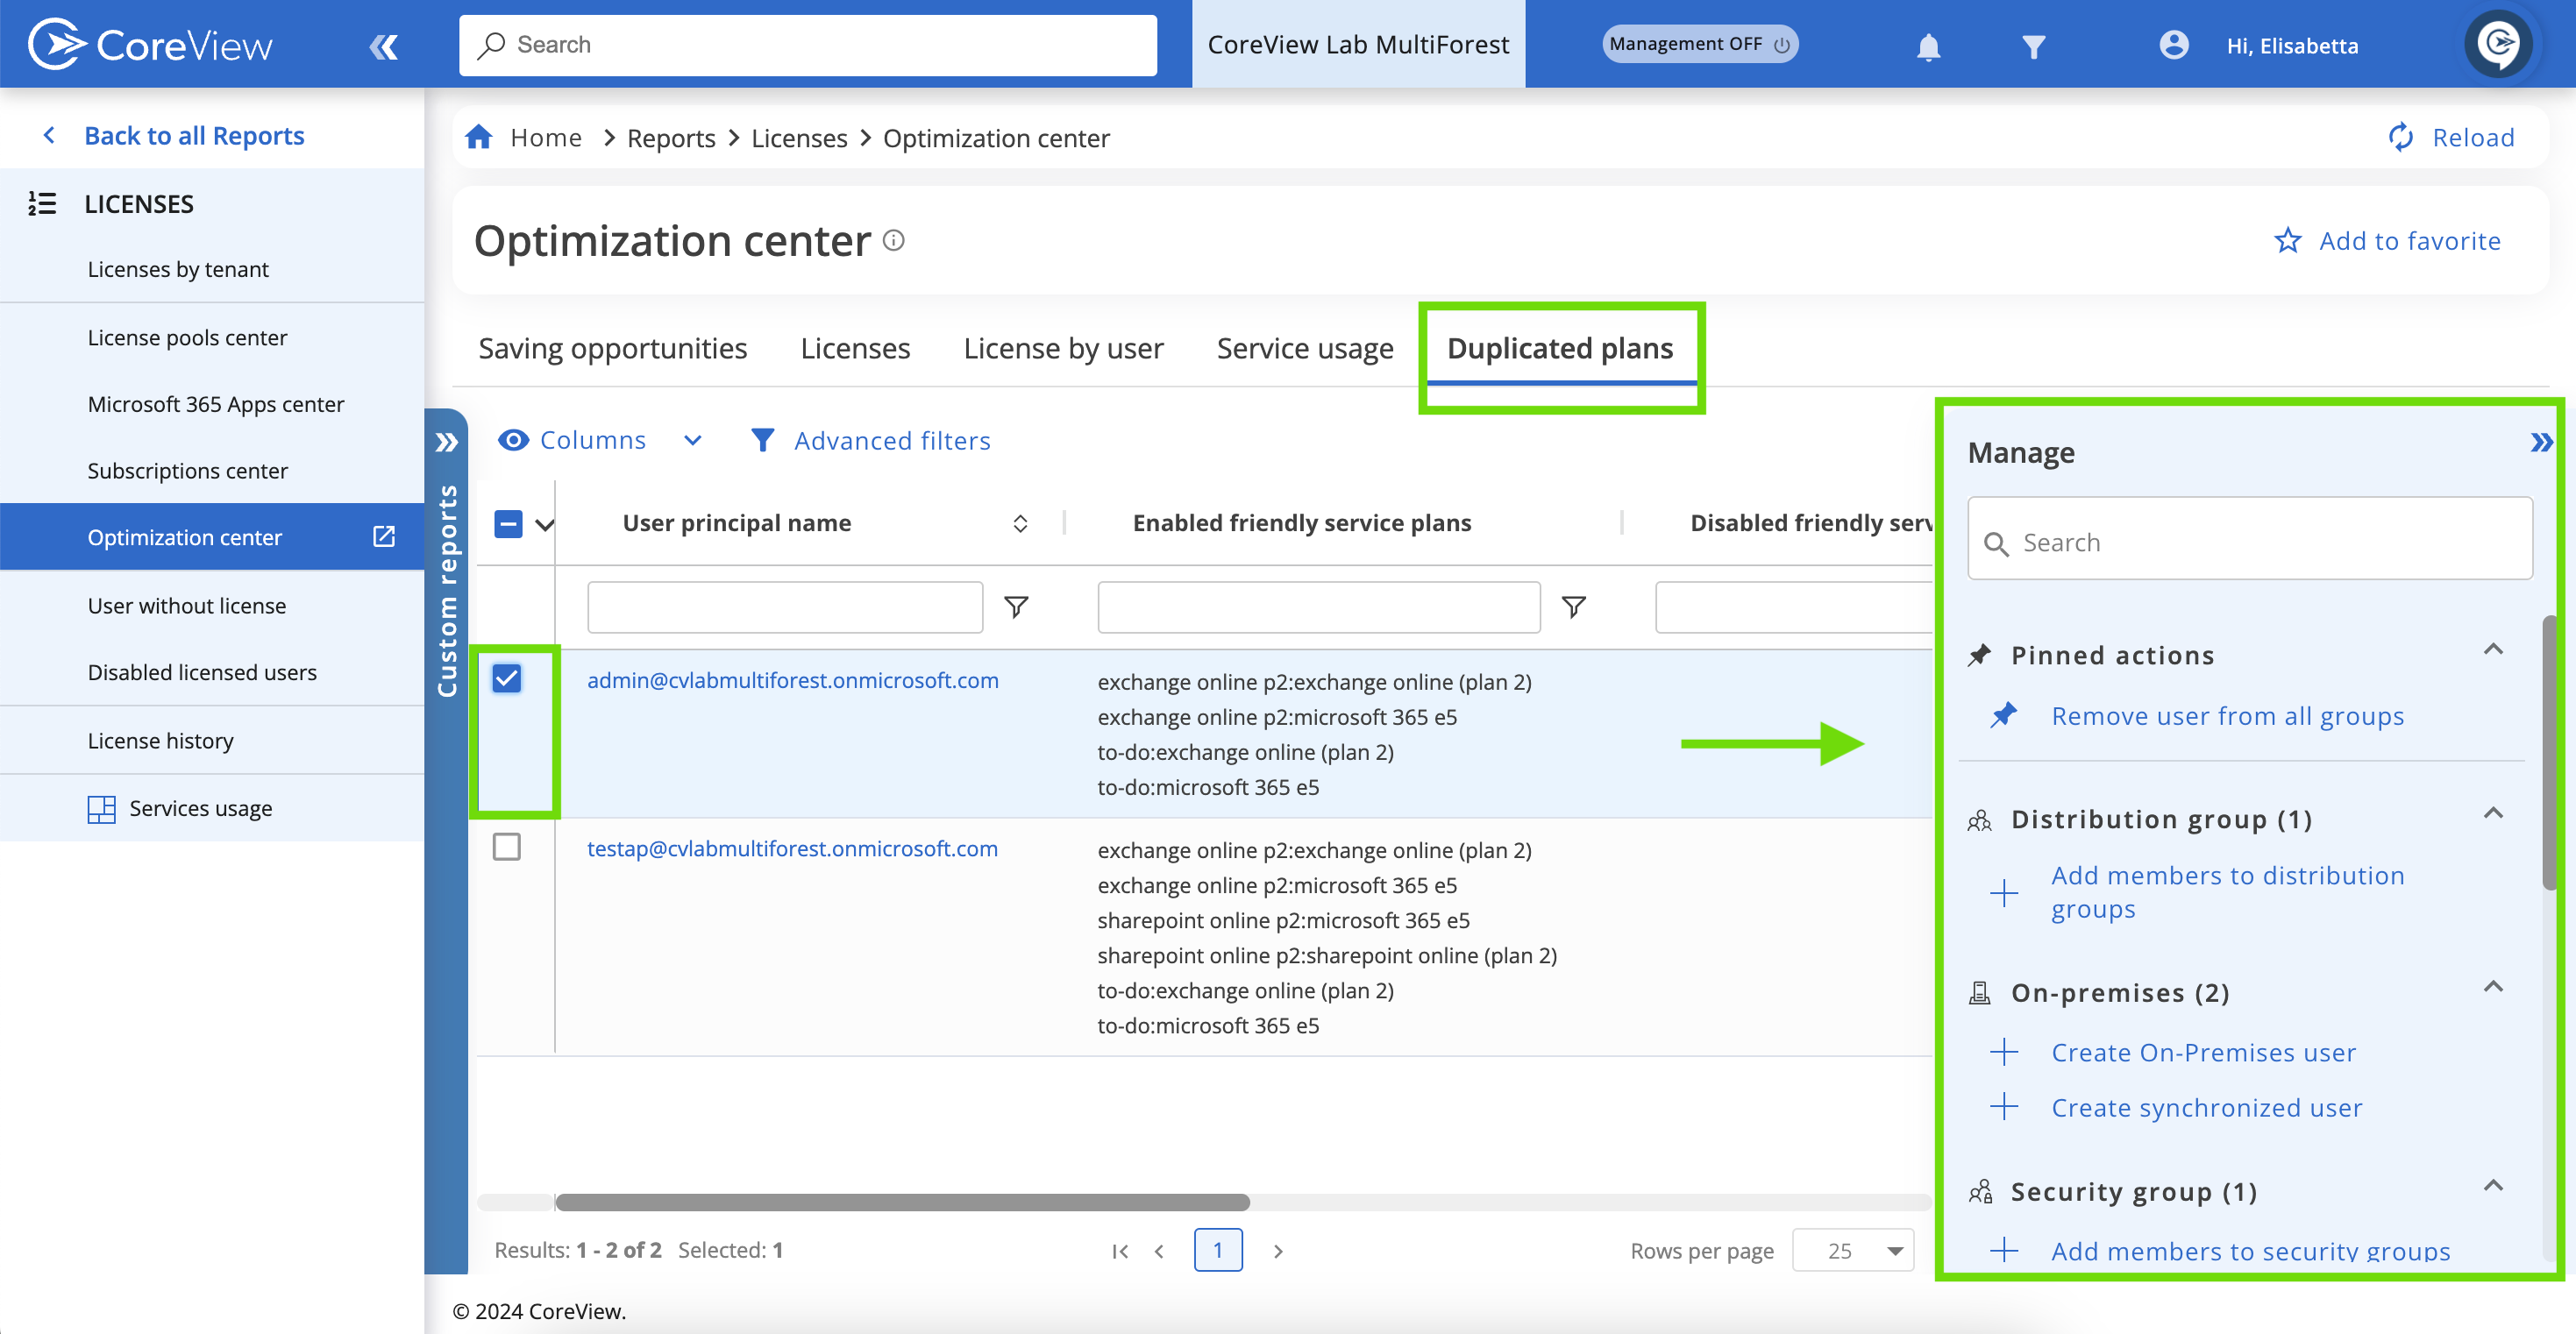
Duplicated plans
The “Duplicated plans” tab is designed to help you effortlessly identify users who have been assigned licenses with overlapping service plans. This feature is particularly useful for pinpointing licenses that could be repurposed, offering a more detailed view than what is available under the “Saving opportunities” or “Licenses” tabs.
To modify licenses and properties directly from this tab, just click on a user. A management panel will appear, showcasing all possible management actions. This streamlined process facilitates efficient license management and optimization.
Management actions are not included in the Essentials solution.