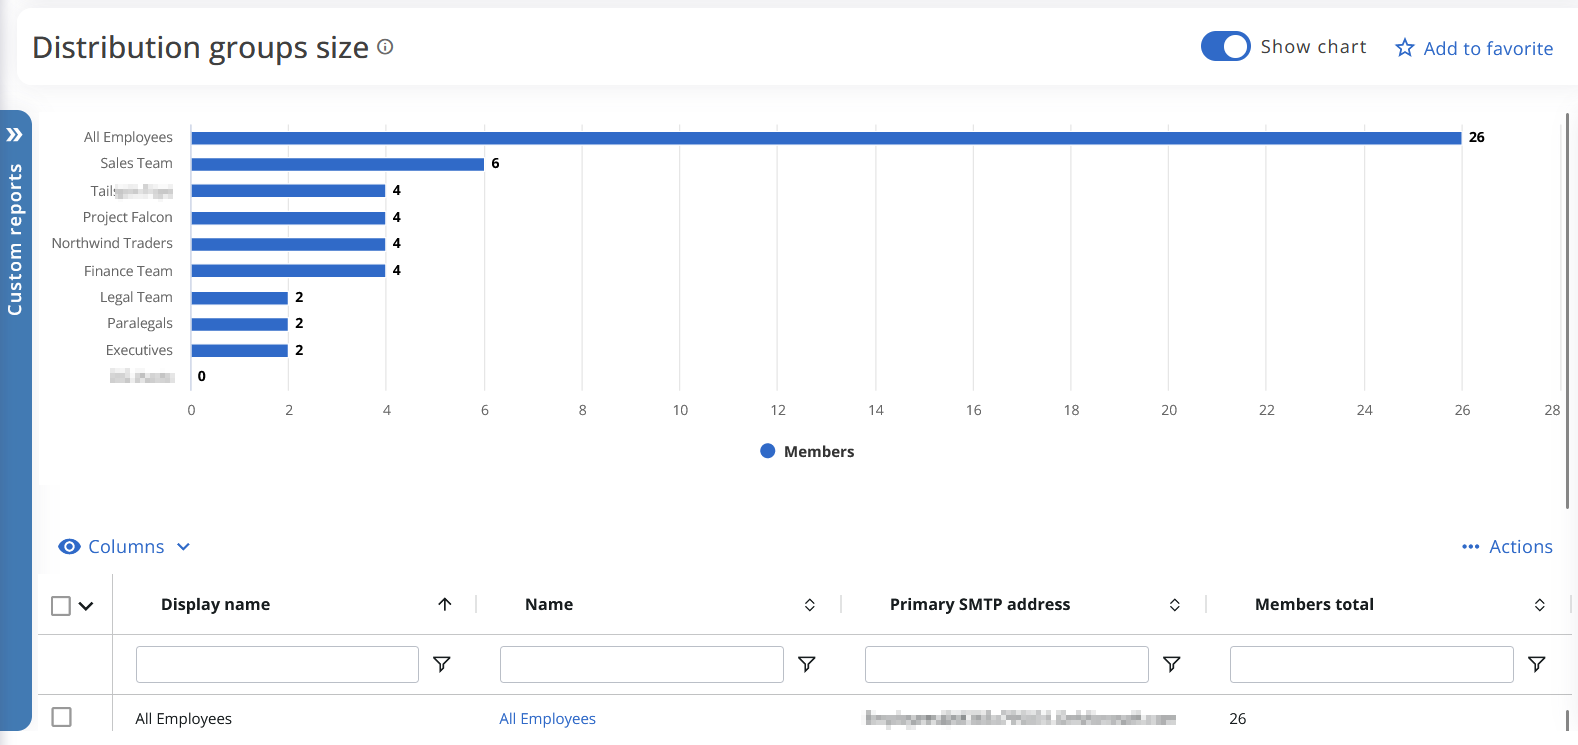
Some reports include a chart that provides a visual representation of the data. You have the option to show or hide this chart based on your preferences.
To control the visibility of the chart, locate the toggle box at the right corner of the screen next to the "Show chart" label:
- If the chart is currently displayed, clicking on the toggle box will hide the chart.
- If the chart is currently hidden, clicking on the toggle box will display the chart.

This feature is available in the following reports:
- Distribution groups size
- Microsoft 365 groups activity
- License history
- Policy application status
- Users with mobile devices
- Mobile devices by policy
- Exchange inactive mailboxes
- Exchange email activity
- Exchange email app usage
- Exchange mailbox usage
- Mailbox sizes
- Archive sizes
- Recipients by type
- Recipient over time
- Users with archive mailbox
- Users by retention policy
- SharePoint site usage
- SharePoint site activity
- SharePoint activity
- SharePoint inactive users
- OneDrive activity over time
- OneDrive activity
- OneDrive inactive users
- OneDrive sizes
- OneDrive statistics
- Teams device usage
- Teams groups activity
- User call quality
- Call quality
- Call quality dashboard
- Voice usage
- Yammer activity
- Yammer groups activity
- Yammer device usage
- Users on litigation hold
- User password settings
- All users password settings
- Mail traffic by user
- Top senders and receivers
- External vs internal (mail traffic)