Monitor policy compliance
Within a Playbook widget, each policy is indicated as compliant or non-compliant according to the threshold set for each policy.
According to the threshold settings, icons and matched item labels are flagged in different colors:
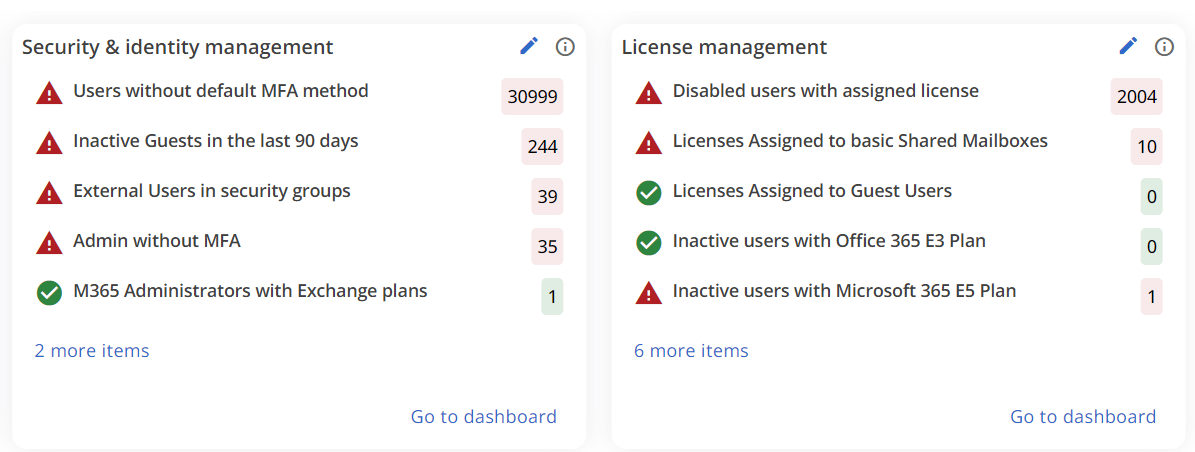
- Red means that the policy is not compliant with the set threshold.
- Green means that the policy is compliant with the set threshold.
- Blue means that the threshold is not set (this only applies to Custom policies).
The number of compliant and non-compliant policies affects the score in each dashboard.
Analyze policies
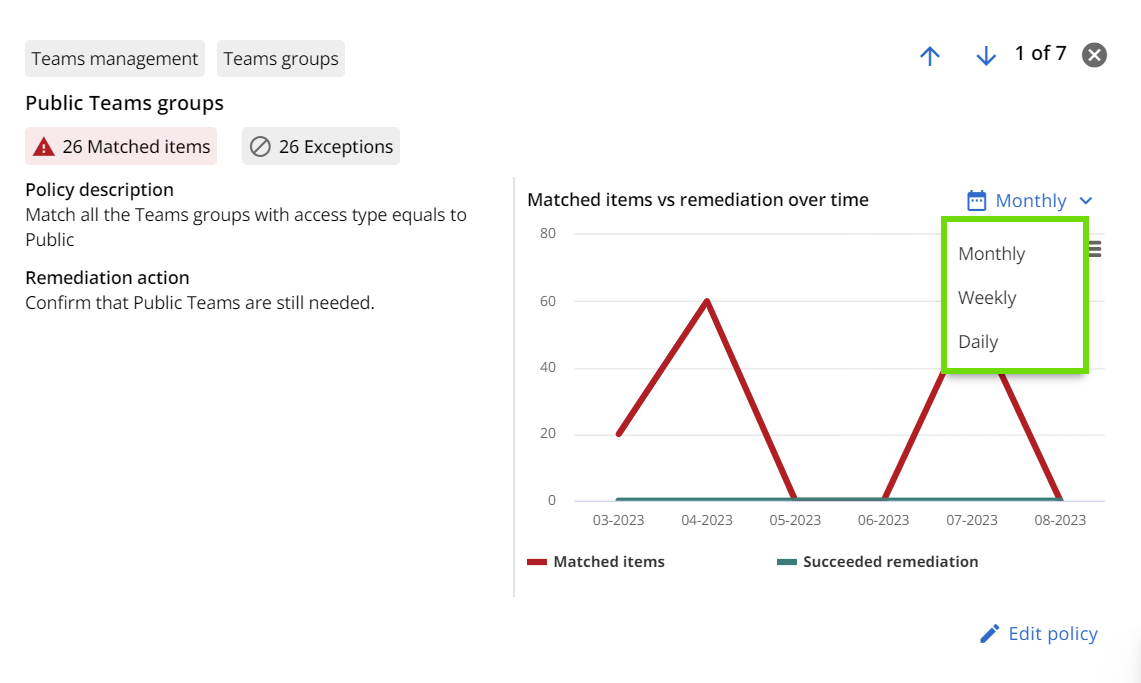
By navigating through the dashboards of playbooks and selecting a policy from the widgets, a modal window will open.
On the modal window, you can view the description, impact, and remediation actions of the policy.
Additionally, the chart provides a comparison between the number of detected matched items and the remediation progress, indicating the number of resolved anomalies over time.
Data points can provide monthly, weekly, and daily information. You can switch views from the dropdown menu in the top-right corner. “Monthly” is the default setting shown after each logout.
For daily views, we take a snapshot of the matched items at a certain time each day. For weekly views, we do this on the last day of the week at a set time. The same goes for monthly views, where the snapshot is taken on the last day of the month.
If the Tenant is in Production, the graph is displayed. Otherwise, if the Tenant is in Trial or Proof-of-Value, the graph is not shown but only the description, impact, and remediation actions of the policy will be visible.