Audit reports allow you to utilize pivot tables to summarize and improve data analysis, offering a deeper understanding of the data, enabling informed decision-making, and presenting results in a clear, organized format.
Why use a pivot table?
- Data aggregation: Pivot tables enable efficient consolidation of large datasets, which facilitates quick analysis and interpretation.
- Data segmentation: Pivot tables assist in segmenting data based on particular criteria, helping to spot trends or irregularities.
- Data comparison: Pivot tables offer a structured way to compare data across various categories, generating valuable insights and supporting data-driven decision-making.
- Automated calculations: Pivot tables boost efficiency by automatically carrying out calculations such as sum, average, count, and percentage, eliminating the need for manual computations.
- Customizability: Pivot tables provide high degrees of customization, allowing users to choose specific data fields, apply different sorting and filtering criteria, and organize the pivot table to meet their specific needs.
CoreView allows you to create Pivot charts, please view how to create them here.
How can I access this feature?
The Pivot table feature can be accessed by enabling the Pivot toggle you can find in all audit reports with the CoreView Audit Log being the only exception. Follow the steps below to use the Pivot table.
Step 1
Turn the Pivot mode toggle on. By default, the toggle should be switched off.
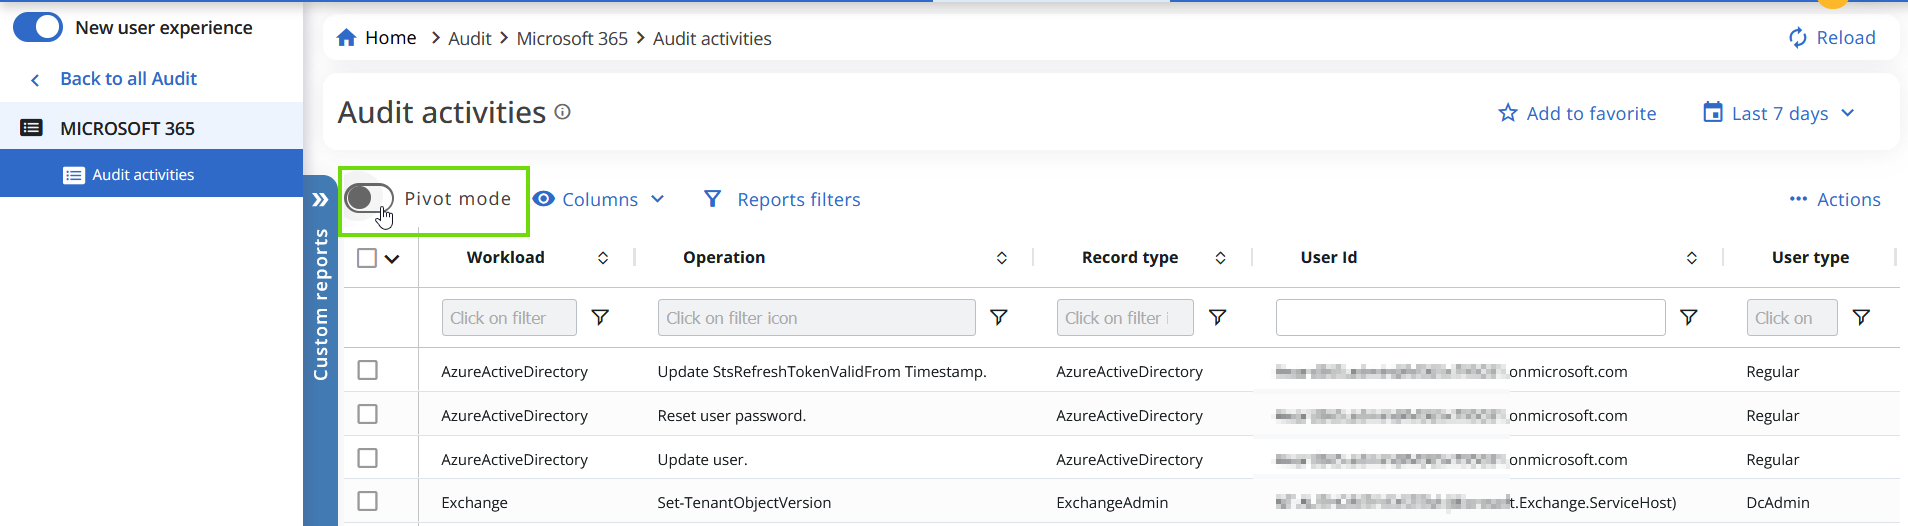
When enabled, the way you visualize your report will shift, and a new selection panel will appear.

Step 2
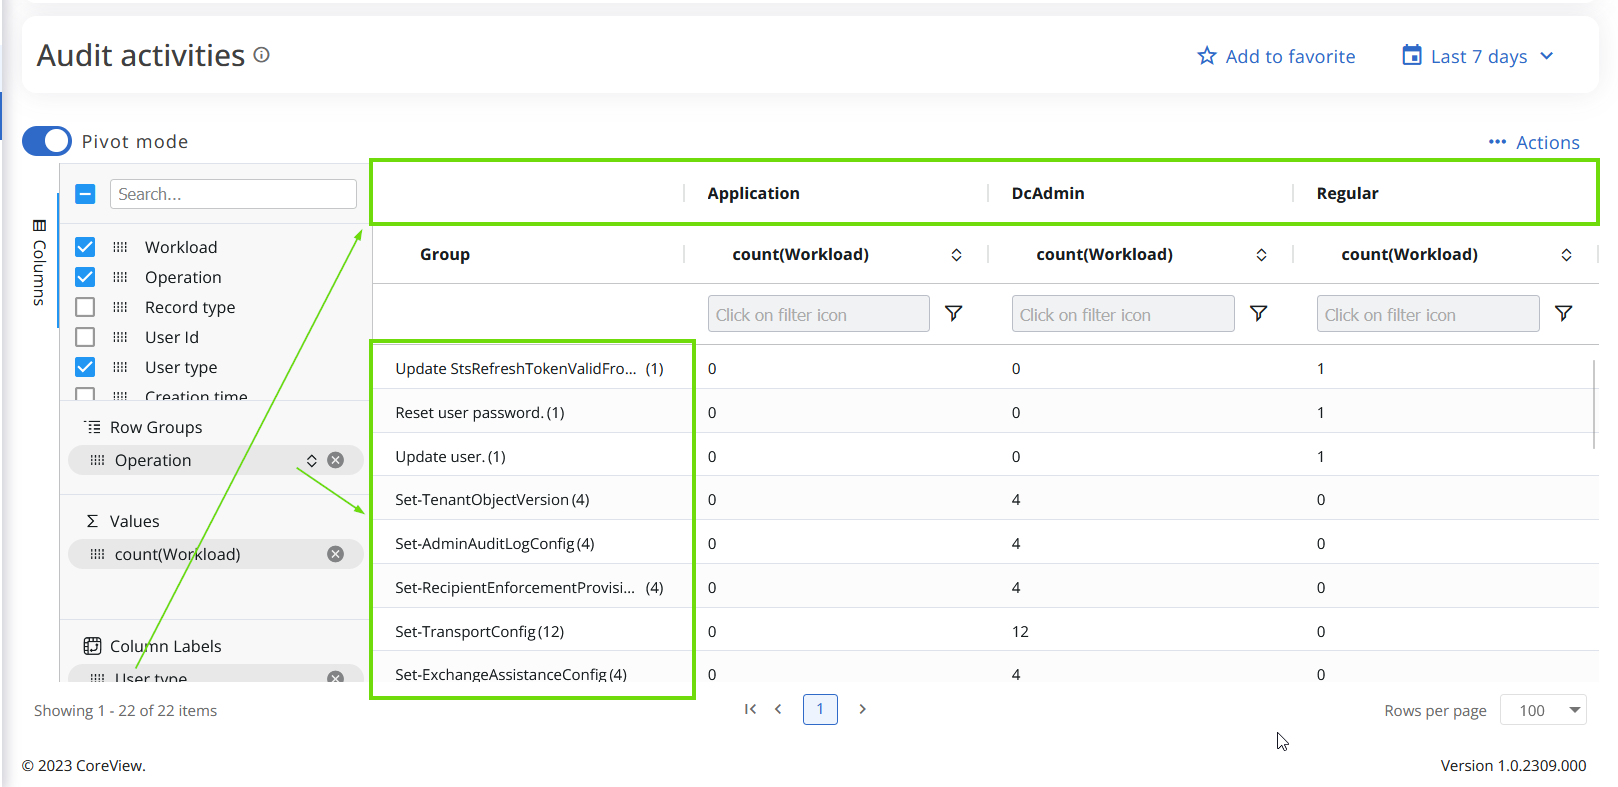
Select the desired attributes and position them into column labels, row groups, or values to customize your data. Use the drag indicator to move the elements.
- In the columns field, check the items you wish to view.
- Drag attributes in the row groups, the values or column labels to filter data.
For example, if you wish to visualize which user types have performed certain actions in Microsoft 365 Audit activities report, you could insert the operation in the row groups, User type the Column labels, and the Workload in the Values field, as shown below:
Step 3
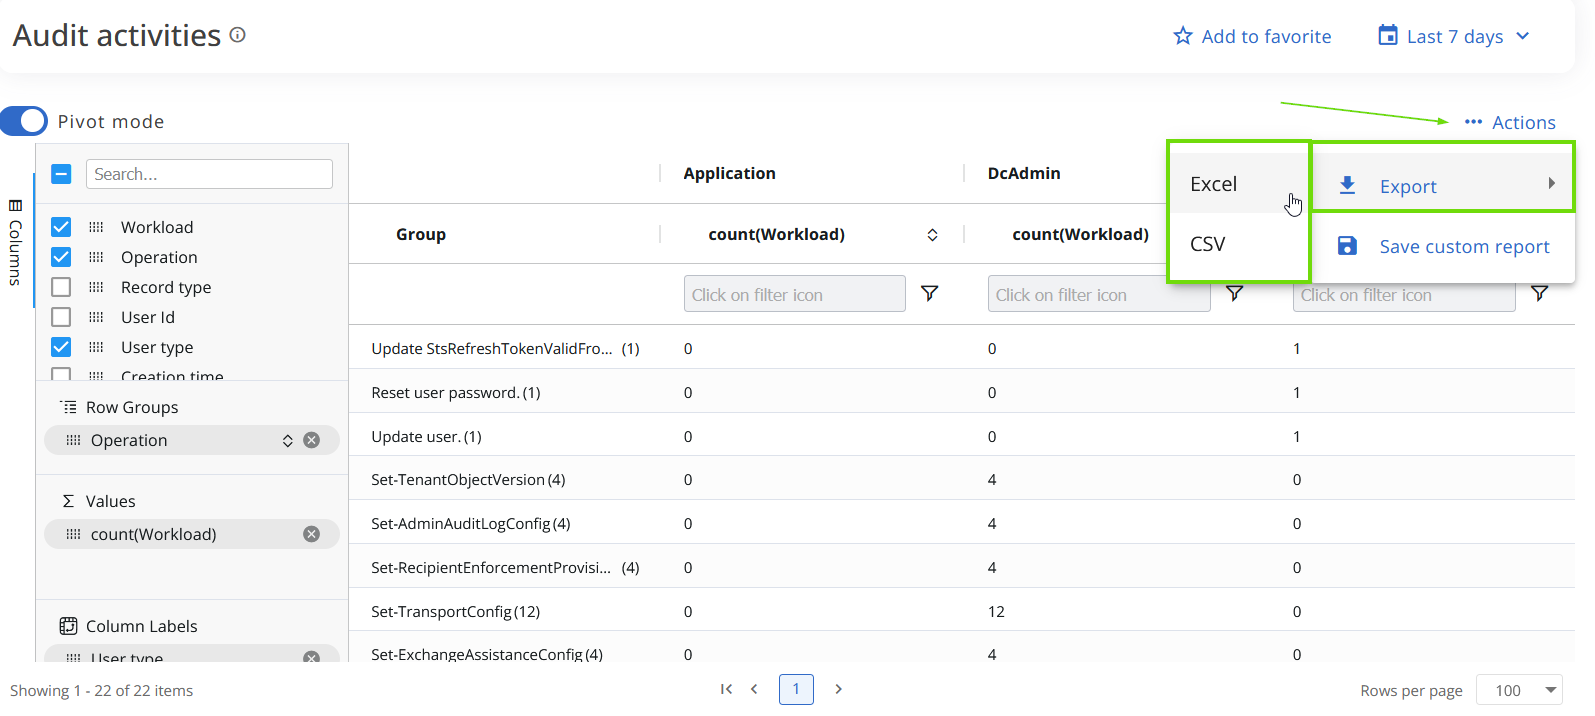
Now, you can
- analyze your data in the application.
- export the data you selected in Excel o CVS format.
- Save the pivot as custom report.
Export Pivot table
To export a report only containing the selected attributes you used to create the Pivot table,
- Select “Actions” > “Export.”
- Choose your desired format.
When you export data in Excel format, for example, you will have the same distribution you have set up in the pivot table:
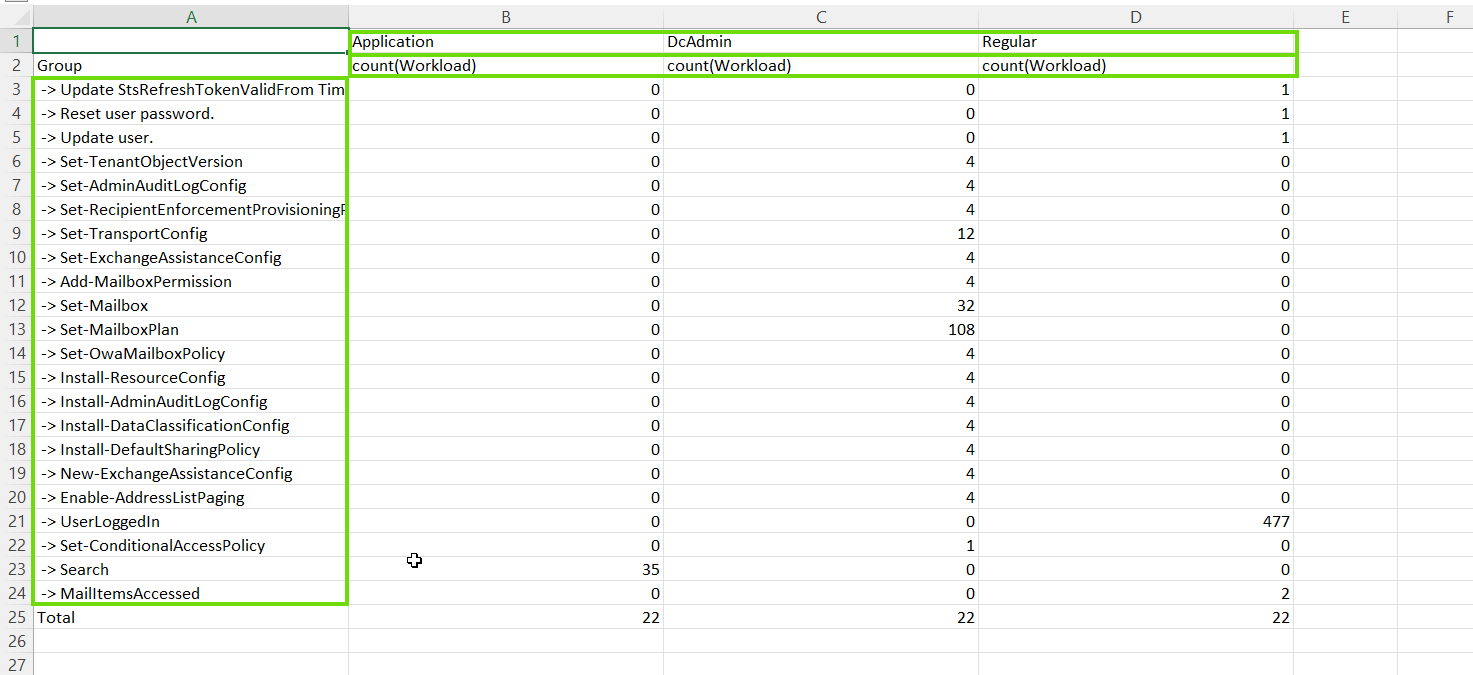
As you now have only your selected attributes in the Excel file, if you wish to, you can now recreate the pivot table directly in Excel.
Save Pivot table as custom report
You can also save your pivot table as a custom report. To do so, follow the steps below.
Step 1
Select Save custom report:

Step 2
Fill in all the required fields and save the report:

Step 3
Find it in your custom reports:

Further information
For further information on how to save an audit report as a custom report, please visit this page.