Each playbook tab comprises the following types of widgets:
- Playbook Summary
- Report widgets
Playbook summary
This widget provides a summary of the policy statuses within the playbook. It displays the following metrics:
- Number of enabled policies
- Number of enabled policies with remediation enabled
- Number of enabled policies without remediation enabled
- Number of policies with remediation scheduled

By clicking on “Manage”, a “Playbook settings” modal window will open, displaying all the policies contained in that Playbook.
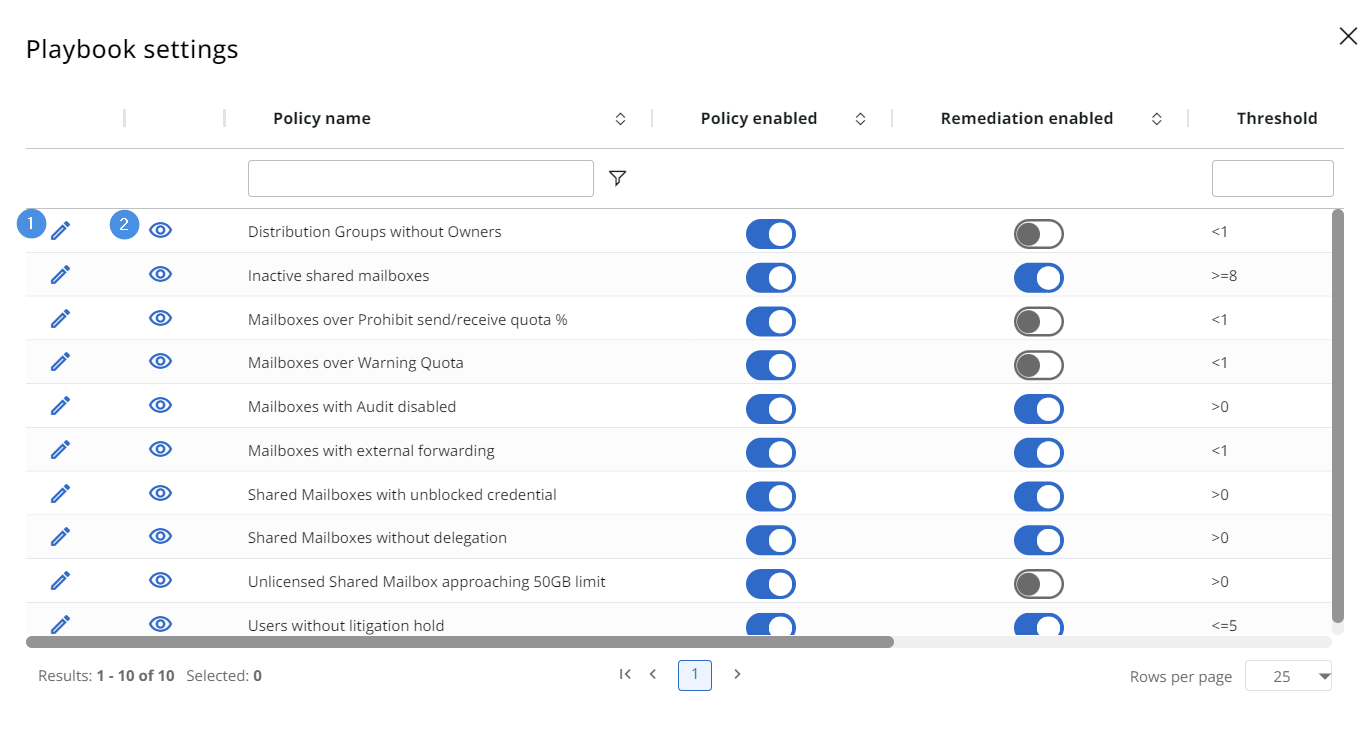
Clicking on the pencil icon (1) will direct you to the Edit panel for that specific policy. On the other hand, clicking on the eye icon (2) will reveal more details about the policies, including the number of matched items, any set exceptions, and a description.
The "Playbook settings" modal also offers a shortcut that allows you to easily enable or disable both the policy and its remediation, eliminating the need to access Settings. To view the set threshold, the remediation type, and to verify if the remediation is scheduled, simply scroll to the right.
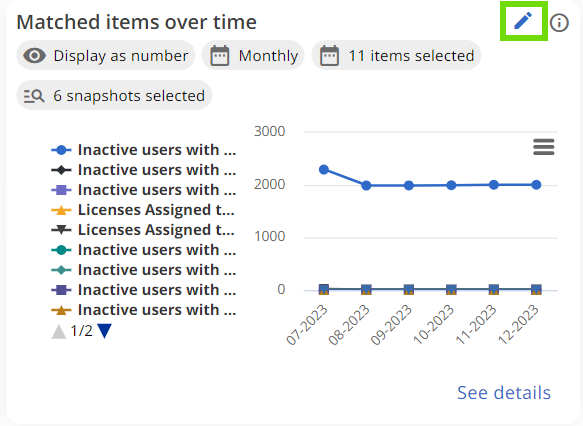
Report widgets
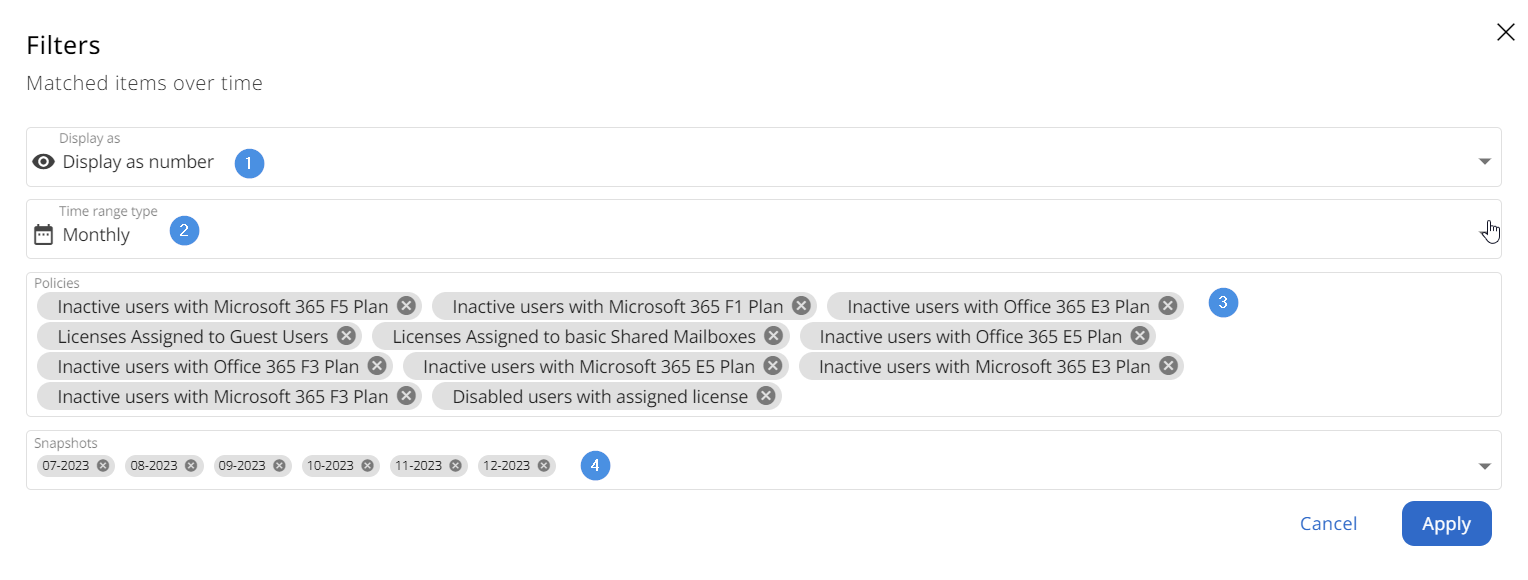
These customizable widgets are the graphic representation of Playbook policy reports. You can customize them by clicking the pen icon in the top-right corner.
This action will prompt a modal to appear, allowing you to alter the following parameters:
- Display the value as number or as percentage
- Choose a time range between monthly, weekly, or daily
- Select which policies to display
- Select which timestamps to display
You can access the full report by clicking on “See details” in the bottom-right corner of the widget.